By Dr. Francis Collins, Director, National Institutes of Health, United States
BETHESDA, Maryland, September 7, 2021 (ENS) – At the end of last year, you may recall hearing news reports that the number of COVID-19 cases in the United States had topped 20 million. While that number came as truly sobering news, it also likely was an underestimate. Many cases went undetected due to limited testing early in the year and a large number of infections that produced mild or no symptoms.
Now, a recent article published in “Nature” offers a more-comprehensive estimate that puts the true number of infections by the end of 2020 at more than 100 million [1]. That’s equal to just under a third of the U.S. population of 328 million.
This revised number shows just how rapidly this novel coronavirus spread through the country last year. It also brings home just how timely the vaccines have been – and continue to be in 2021 – to protect our nation’s health in this time of pandemic.
The work comes from National Institutes of Health grantee Jeffrey Shaman, Sen Pei, and colleagues, Columbia University, New York. As shown in the map, the researchers estimated the percentage of people who had been infected with SARS-CoV-2, the novel coronavirus that causes COVID-19, in communities across the country through December 2020.
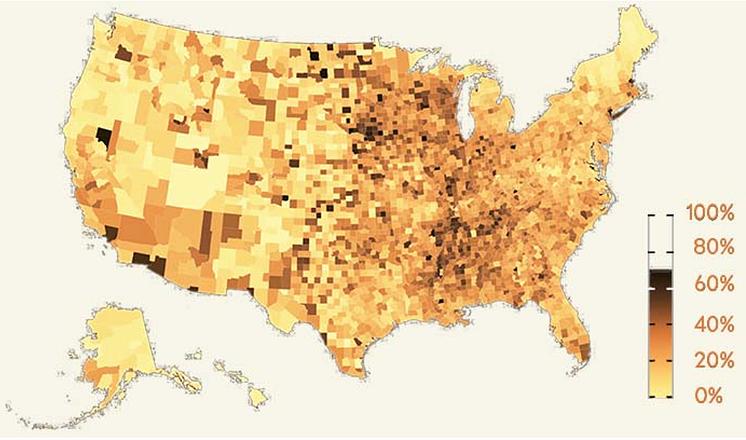
To generate this map, they started with existing national data on the number of coronavirus cases (both detected and undetected) in 3,142 U.S. counties and major metropolitan areas.
They then factored in data from the Centers for Disease Control and Prevention (CDC) on the number of people who tested positive for antibodies against SARS-CoV-2. These CDC data are useful for picking up on past infections, including those that went undetected.
From these data, the researchers calculated that only about 11 percent of all COVID-19 cases were confirmed by a positive test result in March 2020. By the end of the year, with testing improvements and heightened public awareness of COVID-19, the ascertainment rate (the number of infections that were known versus unknown) rose to about 25 percent on average.
This measure also varied a lot across the country. For instance, the ascertainment rates in Miami and Phoenix were higher than the national average, while rates in New York City, Los Angeles, and Chicago were lower than average.

How many people were potentially walking around with a contagious SARS-CoV-2 infection? The model helps to answer this, too.
On December 31, 2020, the researchers estimate that 0.77 percent of the U.S. population had a contagious infection. That’s about 1 in every 130 people on average.
In some places, it was much higher. In Los Angeles, for example, nearly 1 in 40 (or 2.42 percent) had a SARS-CoV-2 infection as they rang in the New Year.
Over the course of the year, the fatality rate associated with COVID-19 dropped, at least in part due to earlier diagnosis and advances in treatment. The fatality rate went from 0.77 percent in April to 0.31 percent in December. While this is great news, it still shows that COVID-19 remains much more dangerous than seasonal influenza (which has a fatality rate of 0.08 percent).
Today, the landscape has changed considerably. Vaccines are now widely available, giving many more people immune protection without ever having to get infected. And yet, the rise of the Delta and other variants means that breakthrough infections and reinfections – which the researchers didn’t account for in their model – have become a much bigger concern.
Looking ahead to the end of 2021, Americans must continue to do everything they can to protect their communities from the spread of this terrible virus. That means getting vaccinated if you haven’t already, staying home and getting tested if you’ve got symptoms or know of an exposure, and taking other measures to keep yourself and your loved ones safe and well.
These measures we take now will influence the infection rates and susceptibility to SARS-CoV-2 in our communities going forward. That will determine what the map of SARS-CoV-2 infections will look like in 2021 and beyond and, ultimately, how soon we can finally put this pandemic behind us.
Reference:
[1] Burden and characteristics of COVID-19 in the United States during 2020. Pei S, Yamana TK, Kandula S, Galanti M, Shaman J. Nature. 2021 Aug 26.
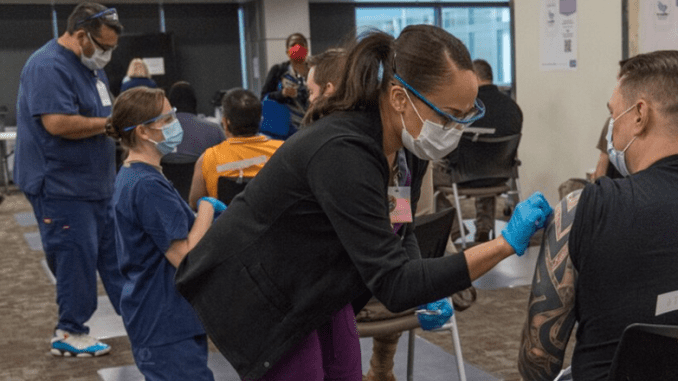
Featured image: U.S. Air Force 59th Medical Wing nurses and medical technicians administer the COVID-19 vaccine, Feb. 2, 2021, Wilford Hall Ambulatory Surgical Center, Joint Base San Antonio-Lackland, Texas. (Photo by Airman 1st Class Melody Bordeaux courtesy U.S. Air Force)
© 2021, Environment News Service. All rights reserved. Content may be quoted only with proper attribution and a direct link to the original article. Full reproduction is prohibited.