
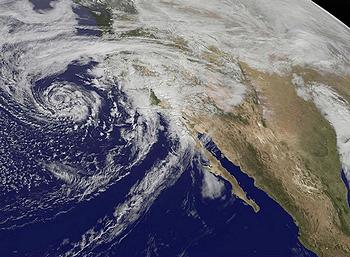
LIMA, Peru, December 3, 2014 (ENS) – The year 2014 is likely to go down in the record books as one of the hottest years in modern history, according to estimates released today by the World Meteorological Organization. One cause is record high global sea surface temperatures, which the WMO expects to remain above normal until the end of the year.
High sea temperatures contributed to exceptionally heavy rainfall and floods in many countries and extreme drought in others.
WMO’s provisional statement on the Status of the Global Climate in 2014 was released at the 20th Conference of the Parties to the UN Framework Convention on Climate Change, now underway in Lima, to inform the annual climate change negotiations.
Final updates and figures for 2014 will be published in March 2015, said the WMO, which gathers weather and climate data from its 191 member governments.
“The provisional information for 2014 means that 14 of the 15 warmest years on record have all occurred in the 21st century,” said WMO Secretary-General Michel Jarraud. “There is no standstill in global warming.”

“What we saw in 2014 is consistent with what we expect from a changing climate. Record-breaking heat combined with torrential rainfall and floods destroyed livelihoods and ruined lives,” said Jarraud.
“What is particularly unusual and alarming this year are the high temperatures of vast areas of the ocean surface, including in the northern hemisphere,” he said.
Ocean heat content for January to June was estimated down to depths of 700 and 2,000 meters; both were the highest ever recorded.
Around 93 percent of the excess energy trapped in the atmosphere by greenhouse gases from fossil fuels and other human activities ends up in the oceans, so the heat content of the oceans is key to understanding the climate system.
From January through October, the global average air temperature over land and sea was about 0.57° Centigrade (1.03 Fahrenheit) above the average of 14.00°Celsius (57.2°Fahrenheit) for the 1961-1990 reference period.
The global temperature over the past 10 years (2004-2013) spiked at 0.09°C (0.16°F) above the average.
If November and December maintain the same tendency, then 2014 will likely be the hottest on record, ahead of 2010, 2005 and 1998. This confirms the underlying long-term warming trend.
The WMO points out that the rankings of the warmest years differ by only a few hundredths of a degree, and different data sets show slightly different rankings.
Greenhouse gases jumped in 2013, with atmospheric levels of carbon dioxide (CO2), methane (CH4), and nitrous oxide (N2O) hitting new highs. Data for 2014 have not yet been processed.
Globally-averaged atmospheric levels of CO2 reached 396.0 parts per million (ppm), about 142% of the pre-industrial average, according to WMO data. The increase from 2012 to 2013 was 2.9 ppm, which is the largest year-to-year increase, with several Northern hemisphere monitoring stations recording levels above 400 ppm.
The overall increase in atmospheric CO2 from 2003 to 2013 corresponds to around 45 percent of the CO2 emitted by human activities. The remaining 55 percent is absorbed by the oceans and forests.
Methane concentrations in the atmosphere reached a new high of 1,824 parts per billion (ppb) in 2013. That is about 253 percent of the pre-industrial level. Global concentrations of N2O reached 325.9 ± 0.1 ppb, 121 percent of the pre-industrial level.
NOAA’s Annual Greenhouse Gas Index shows that from 1990 to 2013, radiative forcing by long-lived greenhouse gases increased by 34 percent. CO2 alone accounted for 80 percent of the increase.
“Record-high greenhouse gas emissions and associated atmospheric concentrations are committing the planet to a much more uncertain and inhospitable future. WMO and its members will continue to improve forecasts and services to help people cope with more frequent and damaging extreme weather and climate conditions,” said Jarraud.
The high January to October temperatures occurred in the absence of a full El Niño-Southern Oscillation, or ENSO.
El Niño conditions occur when warmer than average sea-surface temperatures in the eastern tropical Pacific combine with atmospheric pressure systems, affecting weather patterns across the globe.
During 2014, sea surface temperatures increased nearly to El Niño levels but this was not coupled with an atmospheric response. Still, weather and climate patterns associated with El Niño were observed in many parts of the world.
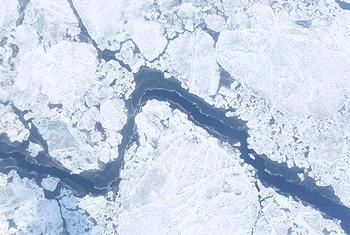
Arctic sea-ice extent reached its annual minimum extent of 5.02 million km2 on September 17 and was the sixth lowest on record, according to the U.S. National Snow and Ice Data Center.
Antarctic daily sea ice reached a maximum daily extent of 20.11 million km2 on September 22, setting a new record for the third consecutive year.
Average surface air temperatures over land for January to October 2014 were about 0.86°C above the 1961-1990 average, the fourth or fifth warmest on record for this period.
Western North America, Europe, eastern Eurasia, much of Africa, large areas of South America and southern and western Australia were especially warm.
Cooler-than-average conditions for the year-to-date were recorded across large areas of the United States and Canada and parts of central Russia.
Heatwaves occurred in South Africa, Australia and Argentina in January. Australia saw another prolonged warm spell in May.
Record heat affected northern Argentina, Paraguay, Bolivia and southern Brazil in October.
Notable cold waves were reported in the United States during the winter, Australia in August and in Russia in October.
Christiana Figueres, executive secretary for the UN Framework Convention on Climate Change, UNFCCC, said, “Our climate is changing and every year the risks of extreme weather events and impacts on humanity rise.”
“Fortunately our political climate is changing too with evidence that governments, supported by investors, business and cities are moving towards a meaningful, universal climate agreement in Paris 2015 – an agreement that keeps a global temperature rise below two degrees Celsius by putting in place the pathways to a deep de-carbonization of the world’s economy and climate neutrality or ‘net zero’ in the second half of the century,” said Figueres.
The WMO global temperature analysis is based on three complementary datasets maintained by:
* – the Hadley Centre of the UK’s Met Office and the Climatic Research Unit, University of East Anglia, United Kingdom (combined);
* – the U.S. National Oceanic and Atmospheric Administration (NOAA) National Climatic Data Center;
* – the Goddard Institute of Space Studies (GISS) operated by the National Aeronautics and Space Administration (NASA)
Global average temperatures are also estimated using reanalysis systems, which use a weather forecasting system to combine many sources of data to provide a more complete picture of global temperatures. WMO uses data from the reanalysis produced by the European Centre for Medium-Range Weather Forecasts.
Copyright Environment News Service (ENS) 2014. All rights reserved.
© 2014, Environment News Service. All rights reserved. Content may be quoted only with proper attribution and a direct link to the original article. Full reproduction is prohibited.