ASHEVILLE, North Carolina, December 31, 2012 (ENS) – In 2012, the United States experienced 11 extreme weather and climate events that cost more than $1 billion in losses, according to the National Oceanic and Atmospheric Administration’s Climactic Data Center.
NOAA counts seven severe weather and tornado events, two tropical storm or hurricane events, and the year-long drought and associated wildfires.
These 11 events combined are believed to have caused 349 deaths.

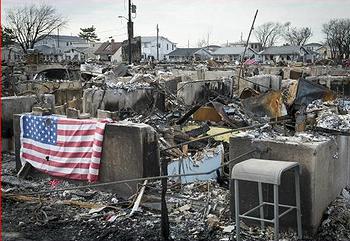
The most worst losses of life occurred during superstorm Sandy, which caused 131 fatalities. Extensive damage occurred across several northeastern states (MD, DE, NJ, NY, CT, MA, RI) due to high wind and coastal storm surge, particularly New York and New Jersey. Damage from wind, rain and heavy snow extended more broadly to other states (NC, VA, WV, OH, PA, NH), as Sandy merged with a developing Nor’easter. Sandy’s impact on major population centers caused widespread interruption to critical water and electrical services
The summer-long heat wave and associated drought caused over 123 direct deaths; in addition, NOAA says an estimate of the excess mortality due to heat stress is still unknown.
The 2012 drought is the most extensive drought to affect the U.S. since the 1930’s. Drought conditions have affected more than half the country for a majority of 2012: (CA, NV, ID, MT, WY, UT, CO, AZ, NM, TX, ND, SD, NE, KS, OK, AR, MO, IA, MN, IL, IN, GA). Drought impacts are most costly across the central agriculture states resulting in widespread harvest failure for corn, sorghum and soybean crops, among others.
Wildfires burned over 9.1 million acres across the U.S. in 2012. This is the second highest annual total since the year 2000, only exceeded by 2006 when 9.4 million acres burned. The most damaging wildfires occurred in the western states (CO, ID, WY, MT, CA, NV, OR, WA). Colorado experienced the most costly wildfires, such as the Waldo Canyon fire where several hundred residences were destroyed.
The eleven events include:
Southeast/Ohio Valley Tornadoes – March 2–3 2012
Texas Tornadoes – April 2–3 2012
Great Plains Tornadoes – April 13–14 2012
Midwest/Ohio Valley Severe Weather – April 28–May 1 2012
Southern Plains/Midwest/Northeast Severe Weather – May 25–30 2012
Rockies/Southwest Severe Weather – June 6–12 2012
Plains/East/Northeast Severe Weather – June 29–July 2 2012
Hurricane Isaac – August 26–31 2012
Western Wildfires – Summer–Fall, 2012
Hurricane Sandy – October 29–31 2012
U.S. Drought/Heatwave – throughout 2012
Economic losses for two events – Sandy and the yearlong drought – are the big drivers this year in terms of costs and are still being calculated. NOAA says it will take months to develop a final, reliable estimate for each.
Given how big these events are likely to be, NOAA estimates 2012 will surpass 2011 in terms of aggregate costs for annual billion-dollar disasters, even with a smaller number of billion-dollar disasters this year.
The greatest annual loss to date was 2005 when Hurricanes Katrina, Rita, Wilma and Dennis struck Florida and the Gulf Coast states. That year costs exceeded $187 billion. All figures are CPI-adjusted to 2012 dollars.
Globally, climate change made itself felt in 2012 as Arctic sea ice shrank to a record low minimum extent and in Antarctica a new study finds that the western part of the continent’s ice sheet is experiencing nearly twice as much warming as previously thought.
The temperature record from Byrd Station, a scientific outpost in the center of the West Antarctic Ice Sheet, demonstrates a marked increase of 4.3 degrees Fahrenheit (2.4 degrees Celsius) in average annual temperature since 1958. Scientists say the rate of increase is three times faster than the average temperature rise around the globe for the same period.
U.S. scientists are worning that climate change is about to get worse. In November, scientists at the at the National Center for Atmospheric Research published a NASA-funded study demonstrating that climate model projections showing a greater rise in global temperature are likely to prove more accurate than those showing a lesser rise.
NCAR scientists John Fasullo and Kevin Trenberth, who co-authored the study, reached their conclusions by analyzing how well sophisticated climate models reproduce observed relative humidity in the tropics and subtropics.
“There is a striking relationship between how well climate models simulate relative humidity in key areas and how much warming they show in response to increasing carbon dioxide,” Fasullo said. “Given how fundamental these processes are to clouds and the overall global climate, our findings indicate that warming is likely to be on the high side of current projections.”
Copyright Environment News Service (ENS) 2012. All rights reserved.
© 2012, Environment News Service. All rights reserved. Content may be quoted only with proper attribution and a direct link to the original article. Full reproduction is prohibited.
